Our Email Communication Report can help you understand how your email marketing strategies are doing. The steps below will walk you through the report.
Navigate to the Communications section of the Portal. Then find the Reporting tab and select Email.

This section will allow you to filter your data by items such as time, segment, and message.
1. Selected Period: This represents the dates in which communication was sent. Any results reflected would be specific to communications sent during the selected time period.
2. Show By: Allows data to be shown by Date, Day of Week, or Hour of Day. This effects the Counts and Rates graphs under Performance Over Time.
3. Schedule Type: Allows messages to be filtered by type, such as All Messages, Scheduled Messages, and Triggered Messages. To learn about the differences between Scheduled and Triggered messages, consult the article here.
4. Customer Segment: All segments are accounted for in this dashboard. To filter your reporting to one segment, select that segment from this dropdown.
NOTE:
5. Message: Allows you to filter your data by one or more specific emails.
6. Communication Tags: Allows messages to be filtered by any communication tags they may have. These tags will have been manually added to your communications by you or other users. You can learn more about them here.
7. Refresh: Allows the filters you’ve set to be applied.

1. This section shows you how your emails are performing.
- SENDS The number of email requests received.
- DELIVERY RATE Delivered/Send
- OPEN RATE Unique Opens/Delivered
- CLICK RATE Unique Clicks/Delivered
2. (Optional) If desired, you can select to have all dashboard data at full screen by hiding the Filter section.

This section defaults to compare the previous period to the current period. You can also compare the same period last year, to the current period.
1. All: This displays a summary of all email data compared against the selected period.
- SENDS The number of email requests received.
- DELIVERIES The number of emails successfully delivered to a contact.
- CLICKS The number of times any link has been clicked in the email.
- OPENS The number of times this email has been opened.
- UNIQUE OPENS The number of unique contacts that have opened this email.
- BOUNCES The number of total bounces received.
- SPAM The number of users who have marked the email as spam. Spam reporting is only possible through certain email providers, Gmail is not one of them. When we receive a spam report we automatically unsubscribe the user from the list.
UNSUBSCRIBES The number of times the Unsubscribe link was clicked in this email.
NOTE:
Values trending positive will appear in green.
Values trending downward will appear in red.
Values holding steady will appear in grey.
 2-4. Counts: This section allows you to drill down into specific comparisons for sends, deliveries opens, and clicks. You have the ability to toggle between items. You can select what you would like to view by clicking on items in the menu (3) or by clicking the values (4).
 5. Rates: This section allows you to drill down into specific comparisons for Delivery, Open and Click Rates. By clicking the keys below the graph (6), you change the visibility for current and previous periods.
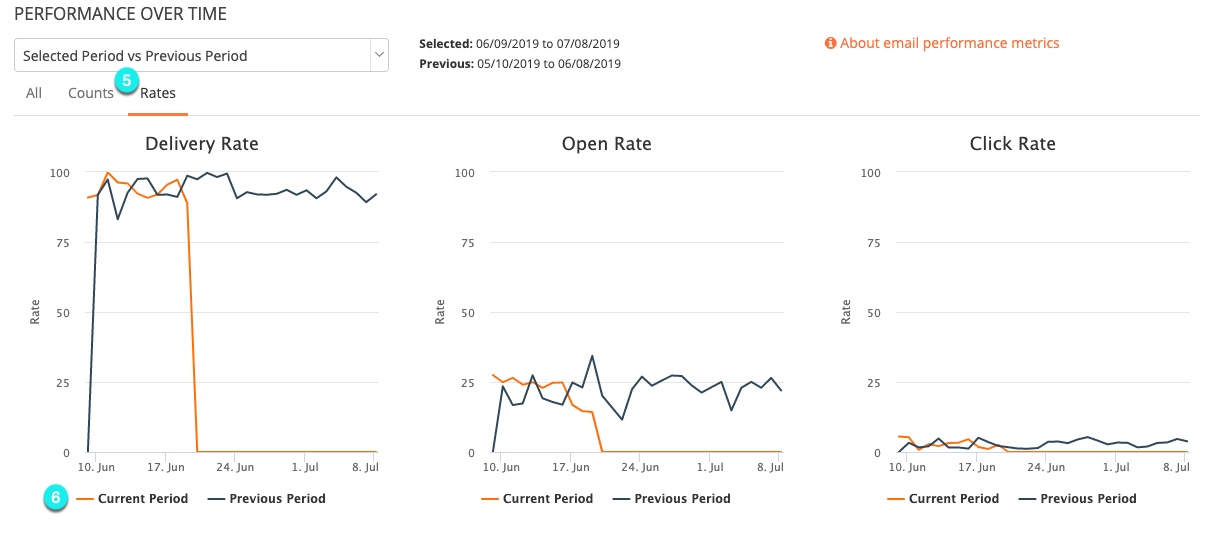
1 & 2. This section showcases your top-performing emails by Open and Click Rates. You can select the button in the top right corner to export this data as an Excel or CSV file.

1. This graph shows how many people opened your email within a certain number of hours from delivery.

2. These graphs display data regarding the devices used to read your emails.
- Device: This chart shows all the different devices used to open all delivered email communications.
- Operating System: This chart shows all the different operating systems used to open all delivered email communications.
- Browser: This chart shows all the different browsers used to open all delivered email communications.

