Once you have the filters you want in place, click the Update button to update your report.
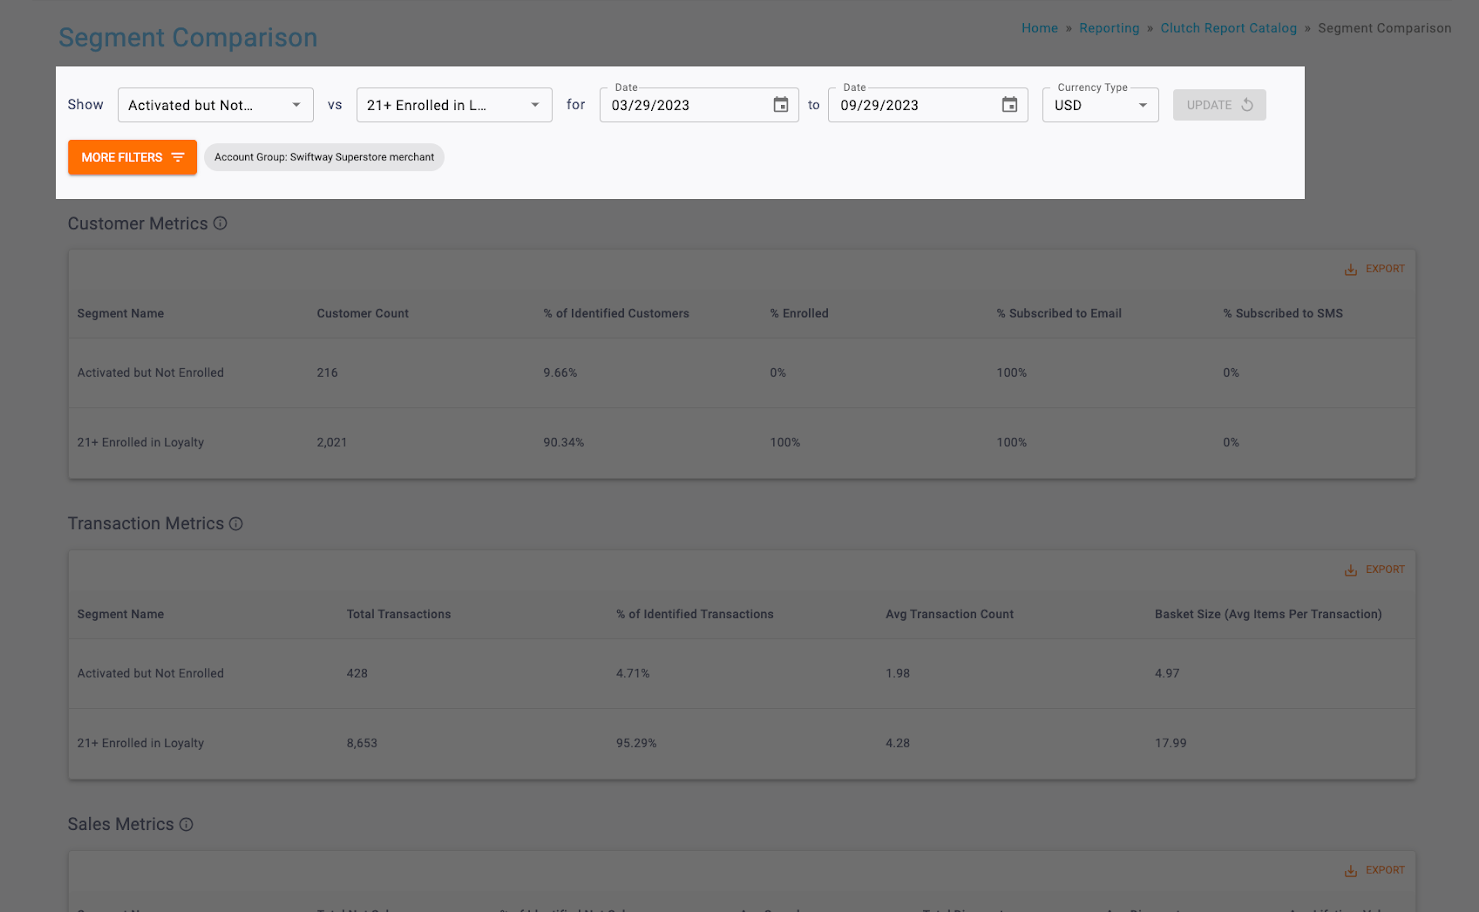

Note: The table results can be downloaded as a CSV using the Export button. Table columns can be temporarily rearranged by holding a click on the column header and dragging to the left or right. These changes are passed through to the Export and reset when the page is reloaded.
Note: The table results can be downloaded as a CSV using the Export button. Table columns can be temporarily rearranged by holding a click on the column header and dragging to the left or right. These changes are passed through to the Export and reset when the page is reloaded.
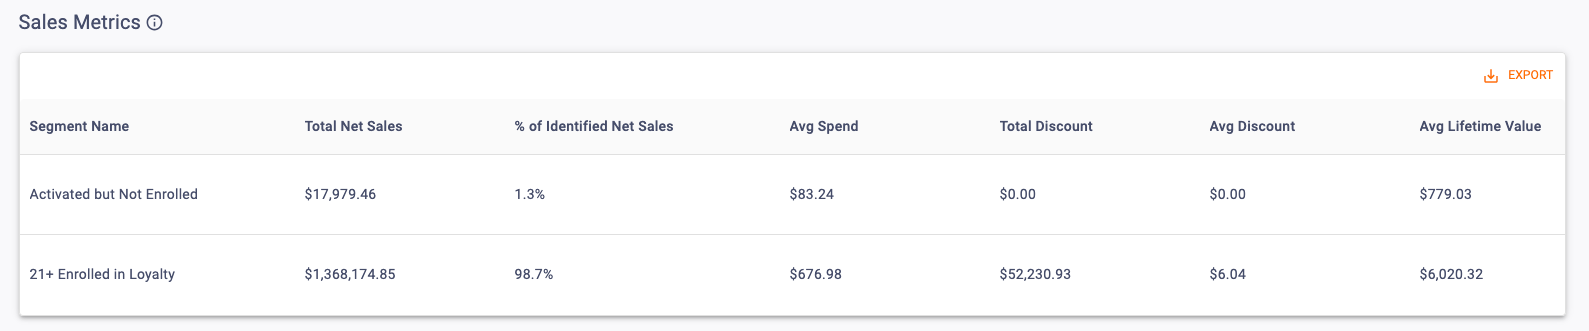
These metrics are based on the filtered historical performance of the current segment membership. You can view the following information in the columns of this table:
These charts compare the two selected segments to show how make up the percent of total for Identified Customers, Identified Transactions, and Identified Net Sales.
Note: Viewing a Segment vs All Others will always add up to 100%, but viewing a Segment vs Segment can add up to less than or more than 100%. Segments are not mutually exclusive or all-inclusive, so the two groups could overlap between them or not capture all of your identified cards.

