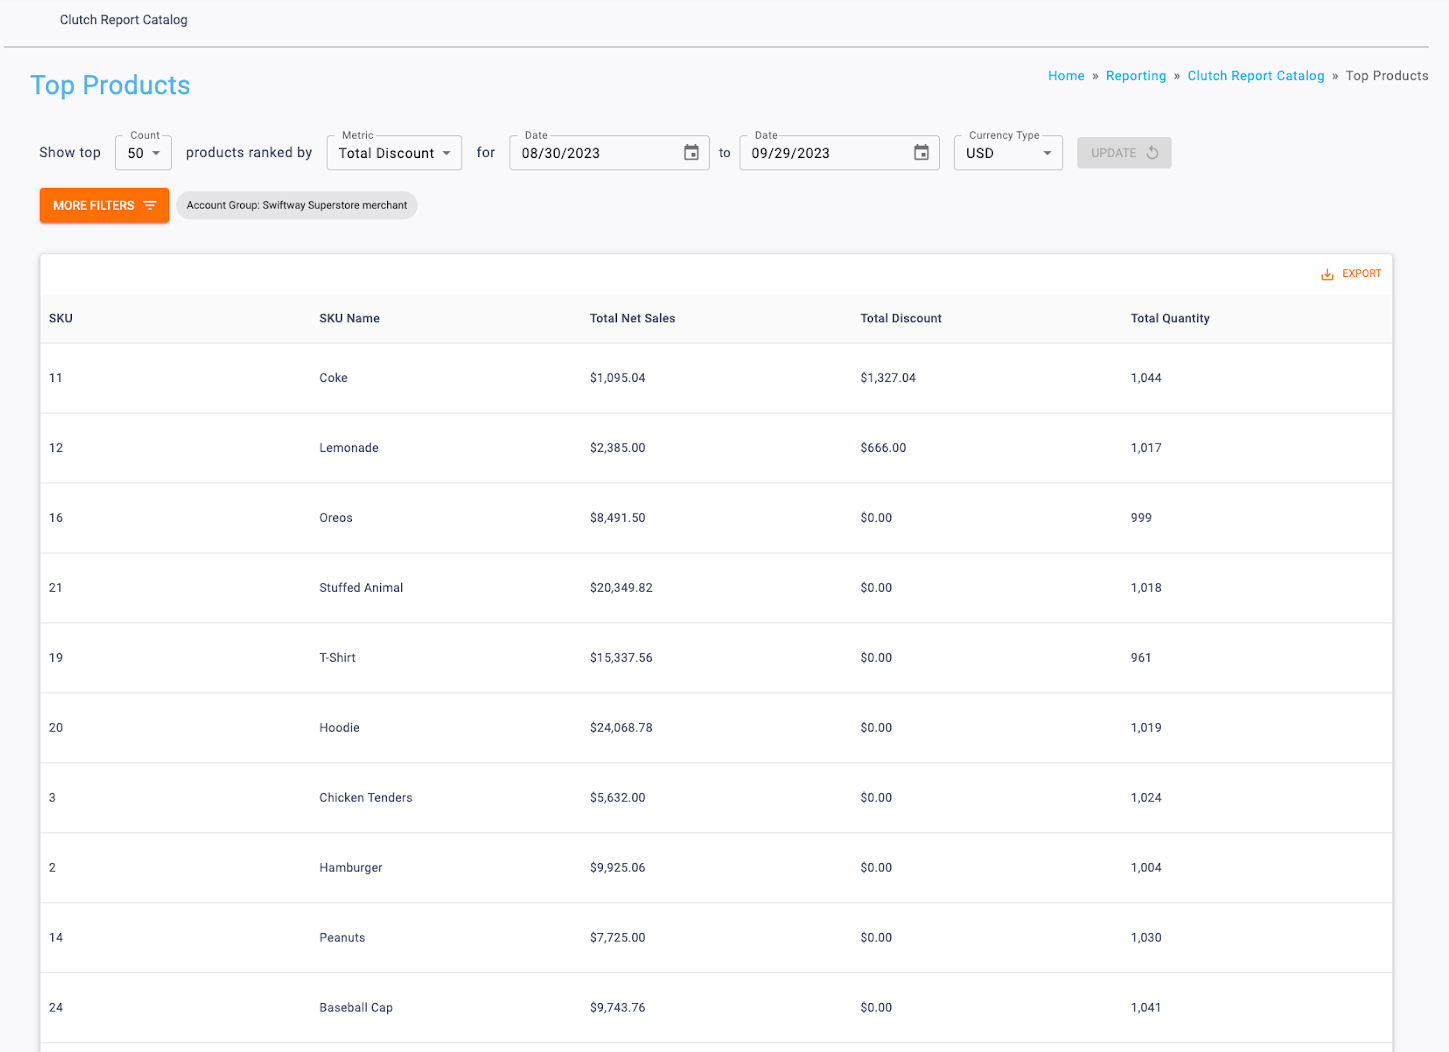
The Top Products Report can be found in the Reporting section of the Clutch Portal. This report allows you to view and rank SKUs by sales metrics including transactions, net sales, discount, and quantity.
Be sure you have an Account Group selected or applied to your user in order to view all of the reports. You can click within each section to learn more about each aspect of the report.
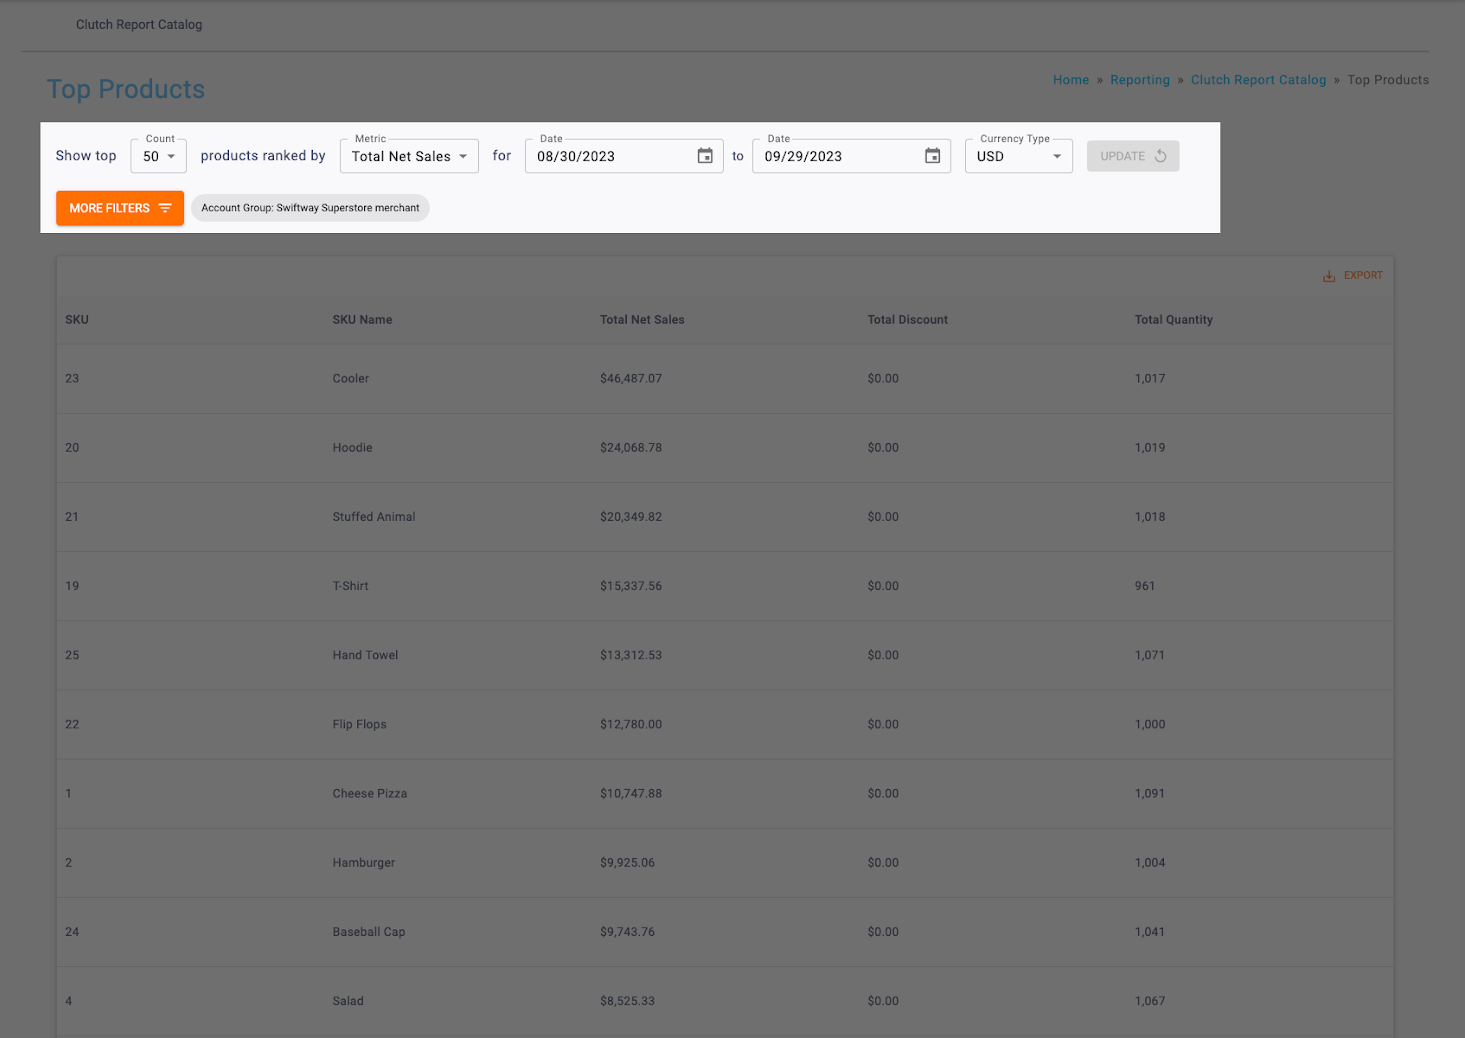
Filters
You’ll be able to target specific data within your report by using the available filters on top. These filters include:
This allows you to control how many results return in your ranking. 50 is the default.
This allows you to control what metric the results are being ranked on. You can choose between Total Net Sales, Total Discount, and Total Quantity. Total Net Sales is the default.
This allows you to filter based on the transaction date. You can select start and end dates. Note that the default for this is the last 6 months.
All dates are specific to the brand’s reporting time zone that is configured in their brand settings.
- Start Dates begin as of 12:00:00AM of the chosen date.
- End Dates end as of 11:59:59PM of the chosen date.
This allows you to filter based on the currency type of the location where the transaction occurred. USD is the default unless your brand does not have any USD locations.
This button opens a drawer to give the user a list of additional optional filters to apply to the report, including Location, Segment, Transaction Type, Order Mode, Revenue Center, and SKU.
Although you may be able to see all of these filters, they may not all apply to your brand. This just depends on how your brand data is configured.
Note that if your user has a Group and/or Location applied in the Account menu, the data may be filtered to that specific Group and/or Location. If these filters have been applied to the report you are viewing, you will see them in the More Filters section.
Once you have the filters you want in place, click the Update button to update your report.
Report Table
You’ll be able to target specific data within your report by using the available filters on top. These filters include:
This shows the SKU number associated with the product.
This shows the name associated with the product.
This shows the total amount minus voids and discounts.
This shows the total amount of item level discount that has been applied to transactions. Order level discounts are not included.
This shows the total quantity of the product that has been sold.
Note: The table results can be downloaded as a CSV using the Export button. Table columns can be temporarily rearranged by holding click on the column header and dragging to the left or right. These changes are passed through to the Export and reset when the page is reloaded.